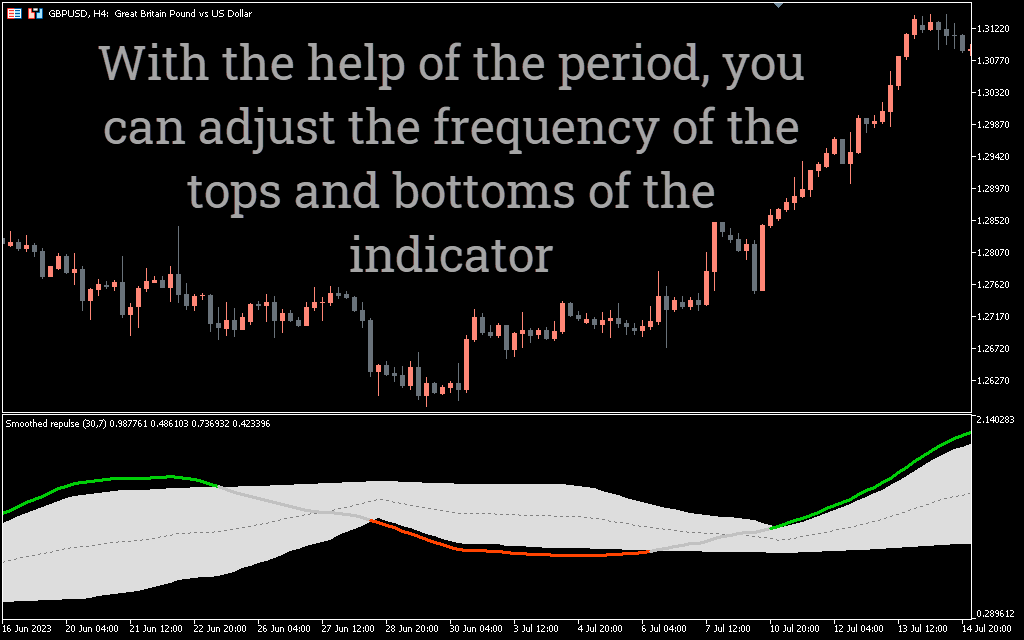
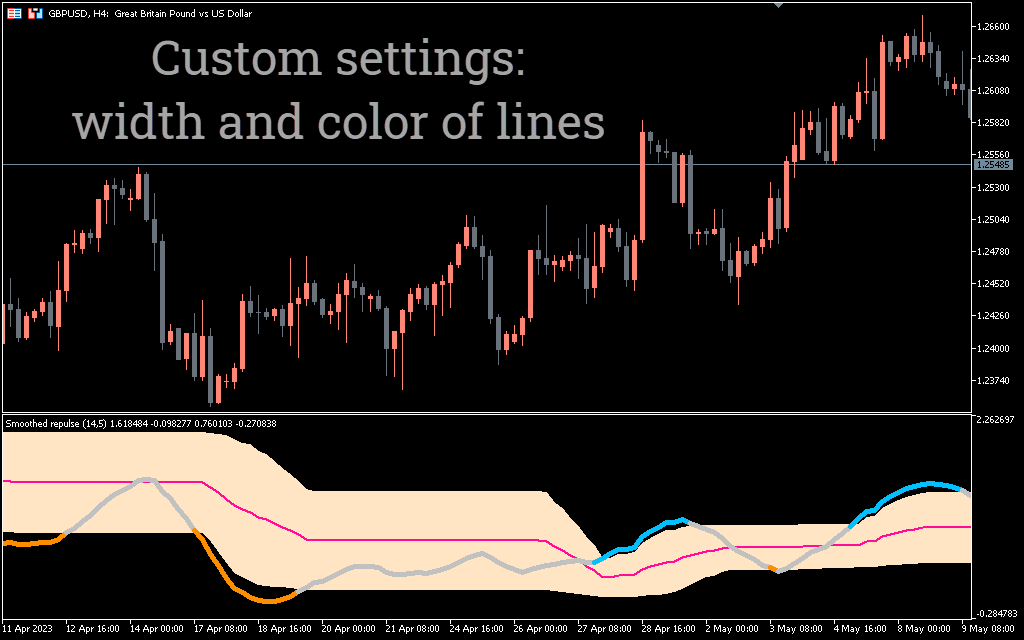
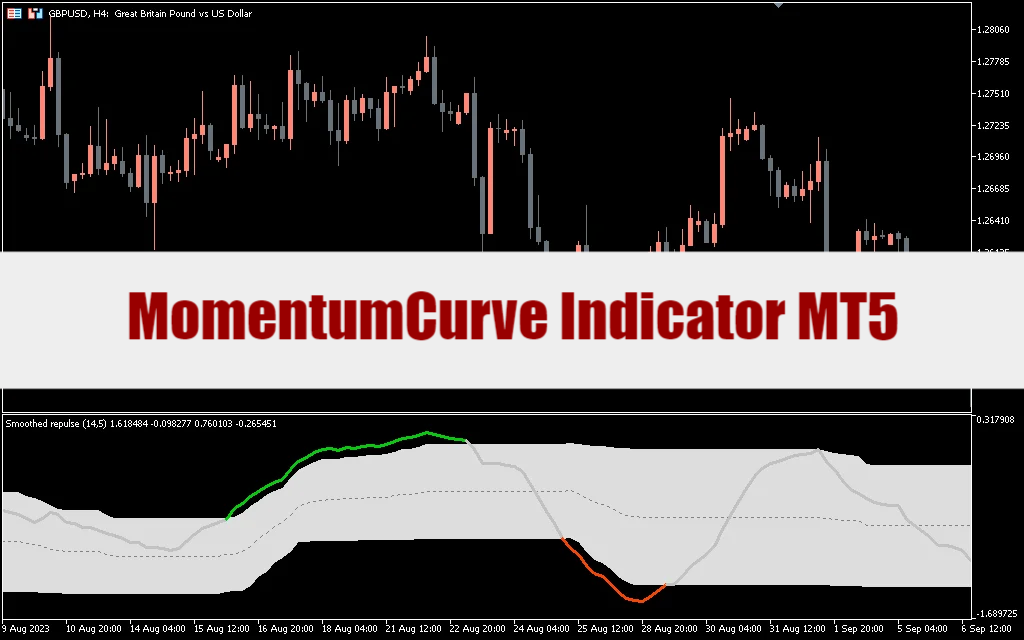
Verbessern Sie Ihre Handelsfähigkeiten mit dem Momentumcurve -Indikator für MT5. Entdecken Sie überkaufte und überverkaufte Bedingungen, um strategische Einstiegspunkte zu bestimmen. Nehmen Sie Ihren Handel mit diesem leistungsstarken Tool auf die nächste Stufe. Der Momentumcurve -Indikator ist ein wertvolles Instrument zur Analyse der Marktstimmung und des Vertrauens des Händlers. Es quantifiziert und visualisiert den Druck jeder Kerze als Kurve, Erkenntnisse über Markttrends und Dynamik geben.
Im Gegensatz zu anderen beliebten Indikatoren wie RSI, MACD, oder stochastisch, Der Impulscurve -Indikator geht über die Preisbewegungsanalyse hinaus. Der Hauptzweck ist es, Informationen über die Wahrnehmung von Händlern und das Vertrauen in die Märkte zu liefern.
Eine nützliche Methode für die Nutzung besteht darin, Impulscurve zu zeichnen(1) (Sehr kurzfristig), Impulskurve(5), und Momentumcurve(15) in derselben Tabelle. Dies kann dazu beitragen, Trends in den Futures -Märkten zu identifizieren, Ermöglichen Sie, dass Sie Trends für verschiedene Zeiträume in einem einzigen Diagramm beobachten.
So verwenden Sie den Impuls -Indikator
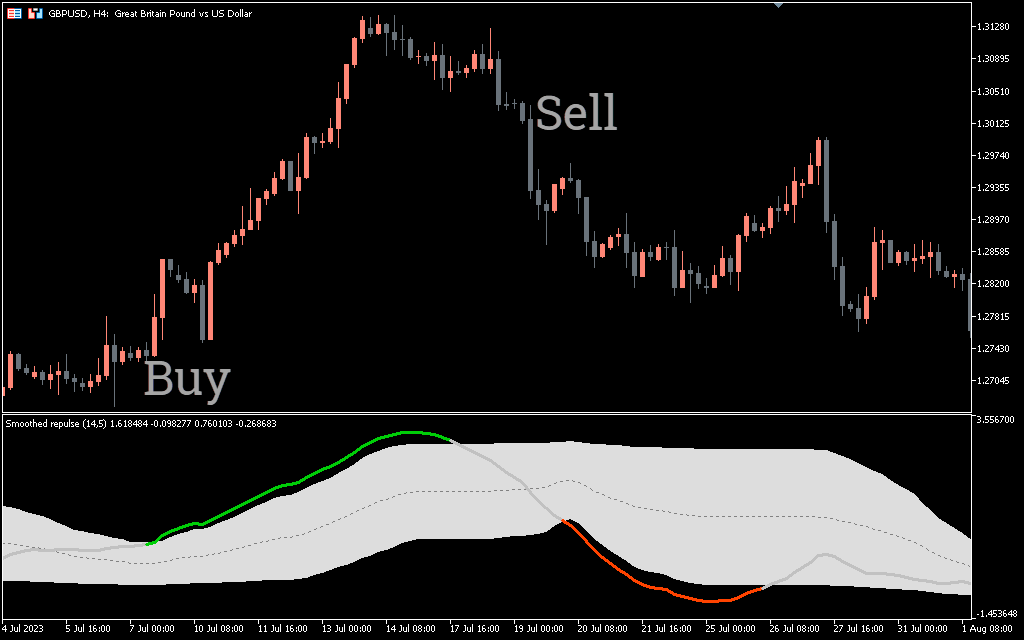
Um den Impulscurve -Indikator in MT5 zu verwenden, Sie müssen seine Komponenten verstehen. Es besteht aus einer Null -Linie und einer Impulskurve. Die Kurve schwankt über und unter der Nulllinie, MARKTMARTION DOMPENTUM angeben. Wenn sich die Kurve über der Nulllinie bewegt, Es deutet auf einen zunehmenden Kaufdruck vor. Umgekehrt, Wenn die Kurve unter die Nulllinie fällt, Es weist auf einen steigenden Verkaufsdruck hin.
Der Indikator enthält auch Signale für Handelseinträge. Wenn sich die Kurve über der Nulllinie bewegt und auf der vertikalen Skala hohe Werte erreicht, Es deutet auf einen überkauften Markt und eine potenzielle Umkehrung hin. Dies dient als Verkaufssignal. Auf der anderen Seite, Wenn die Kurve unter die Nulllinie fällt, Es deutet auf einen überverkauften Markt und eine bevorstehende Aufwärtsumkehr hin. Dies dient als Kaufsignal.
Anzeigeeinstellung:
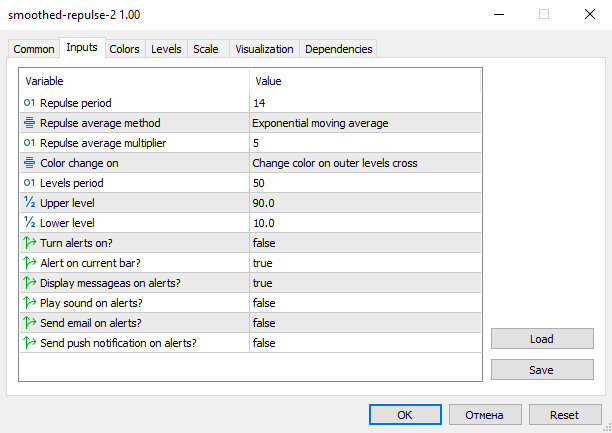
Momentumcurve Periode: Geben Sie den Kurvenlängenwert ein.
Impulscurve -durchschnittliche Methode: Geben Sie den Kurven -durchschnittlichen Methodentyp ein.
Impulscurve Durchschnittlicher Multiplikator: Geben Sie den durchschnittlichen Multiplikatorwert der Kurve ein.
Farbwechsel: Wählen Sie, wann Sie die Farbe ändern sollen.
Ebenenzeitraum: Geben Sie den Längenwert der Ebenen ein.
Obere Ebene: Geben Sie den Wert der oberen Ebene ein.
Niedrigere Ebene: Geben Sie den Wert niedrigerer Ebene ein.
Warnungen: Aktiviert oder deaktiviert verschiedene Alarmeinstellungen.
Abschluss
Abschließend, Der Impulscurve -Indikator ist ein wertvoller Oszillator, der dazu beiträgt, überkaufte und überverkaufte Bedingungen zu identifizieren. Darüber hinaus, Es bietet nützliche Handelseintragssignale. Indem Sie diesen Indikator in Ihre Analyse integrieren, Sie können Einblicke in die Marktstimmung erhalten und fundiertere Handelsentscheidungen treffen.

Es gibt noch keine Bewertungen